CASE STUDY

KIDREVIEWEDTN.COM
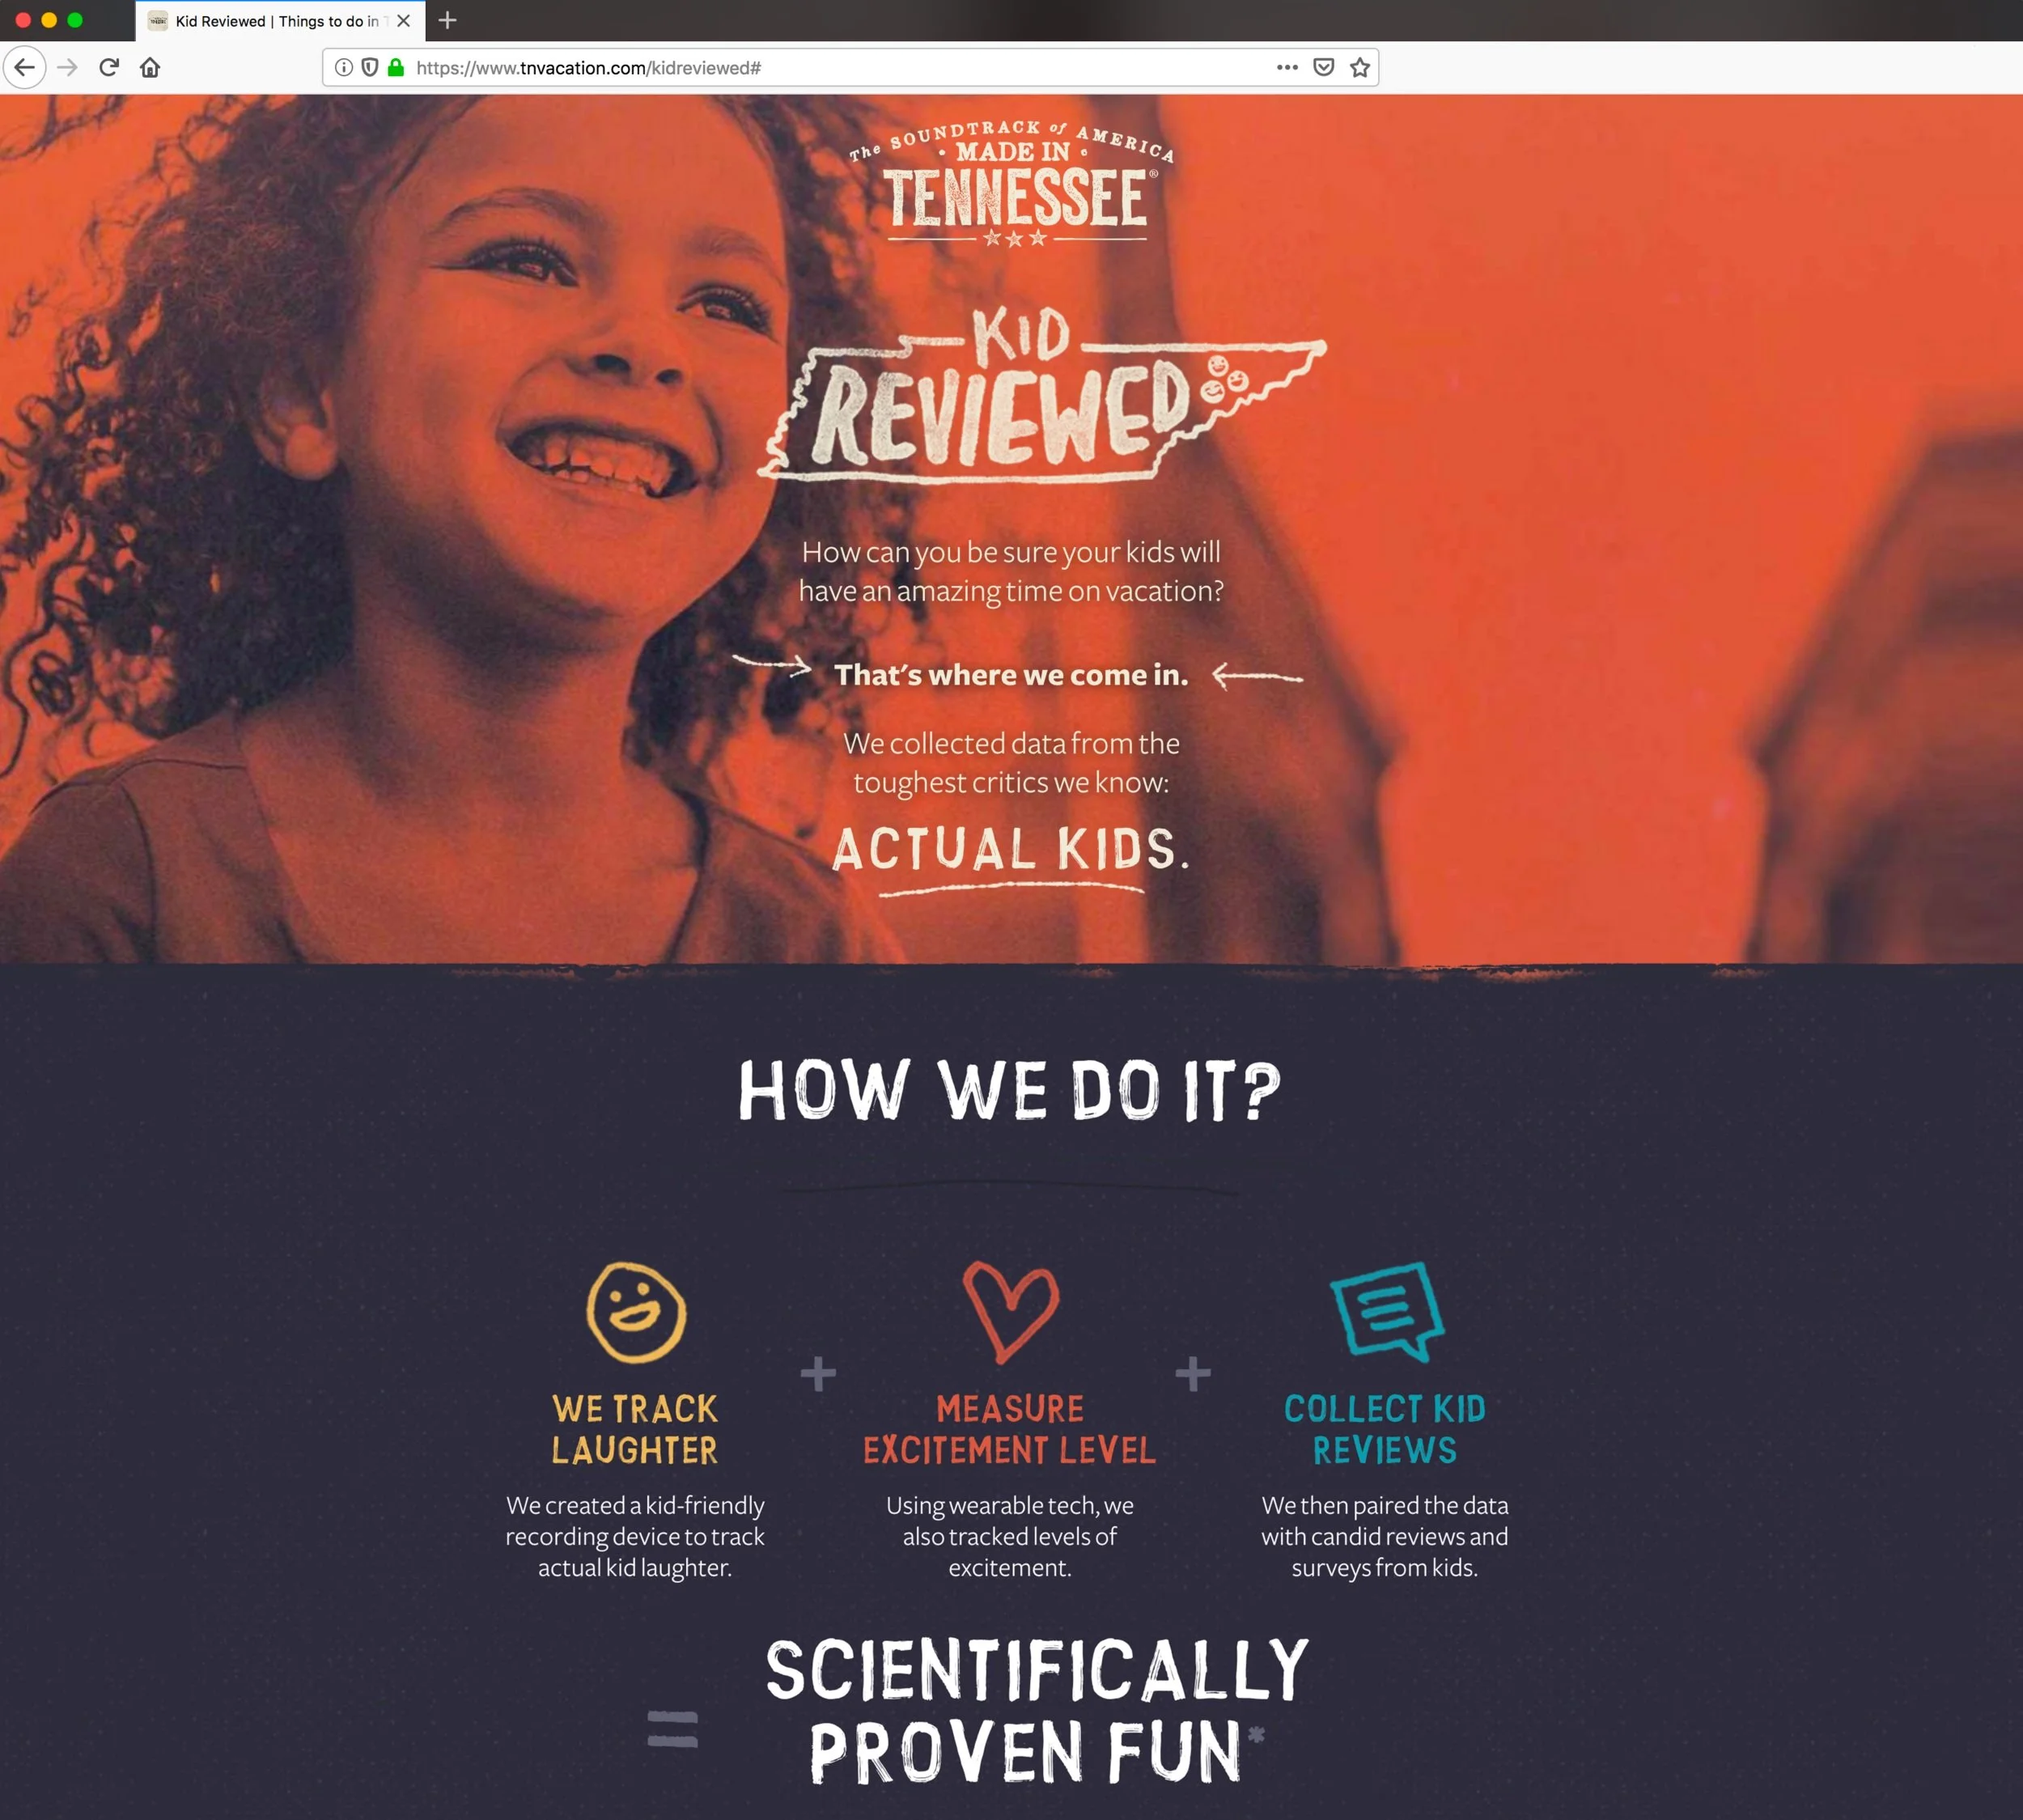
Laugh tracker data was fed to a branded website to help moms plan their Tenesse vacation. Click the image below.

OUTDOOR
Digital billboards that changed daily displayed average laughs per day at Dollywood.
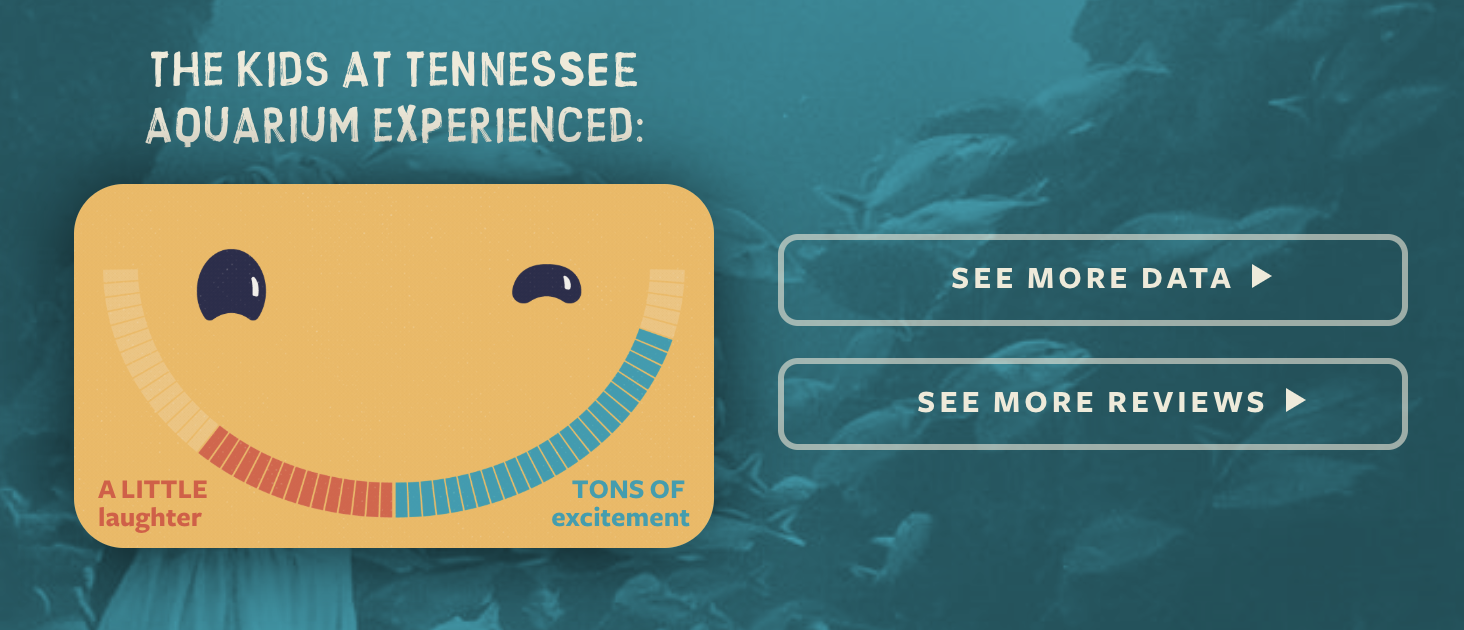
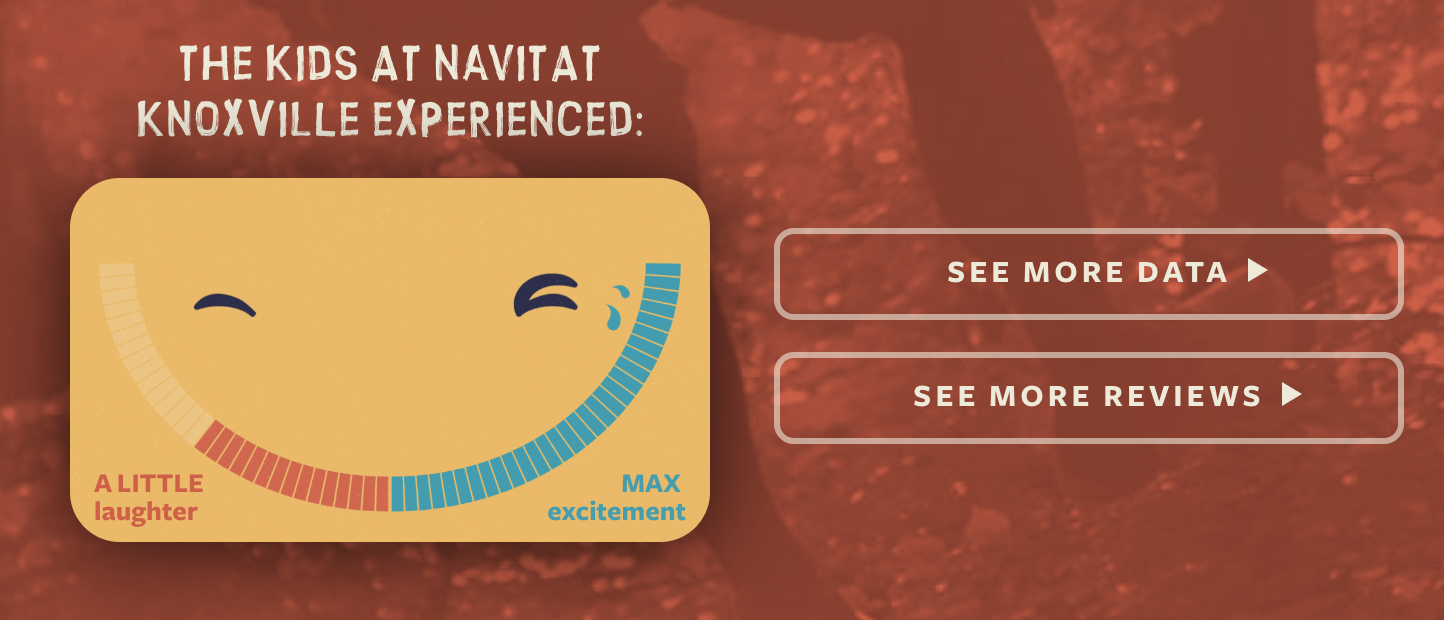
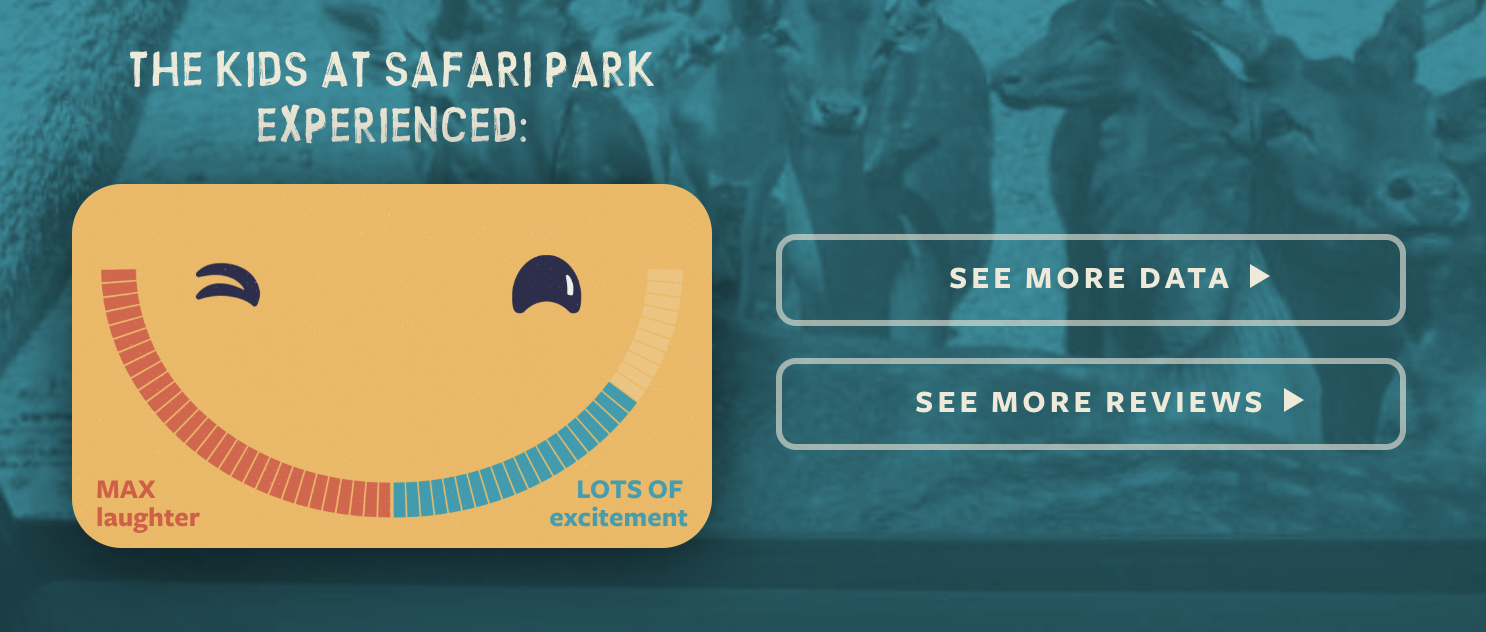
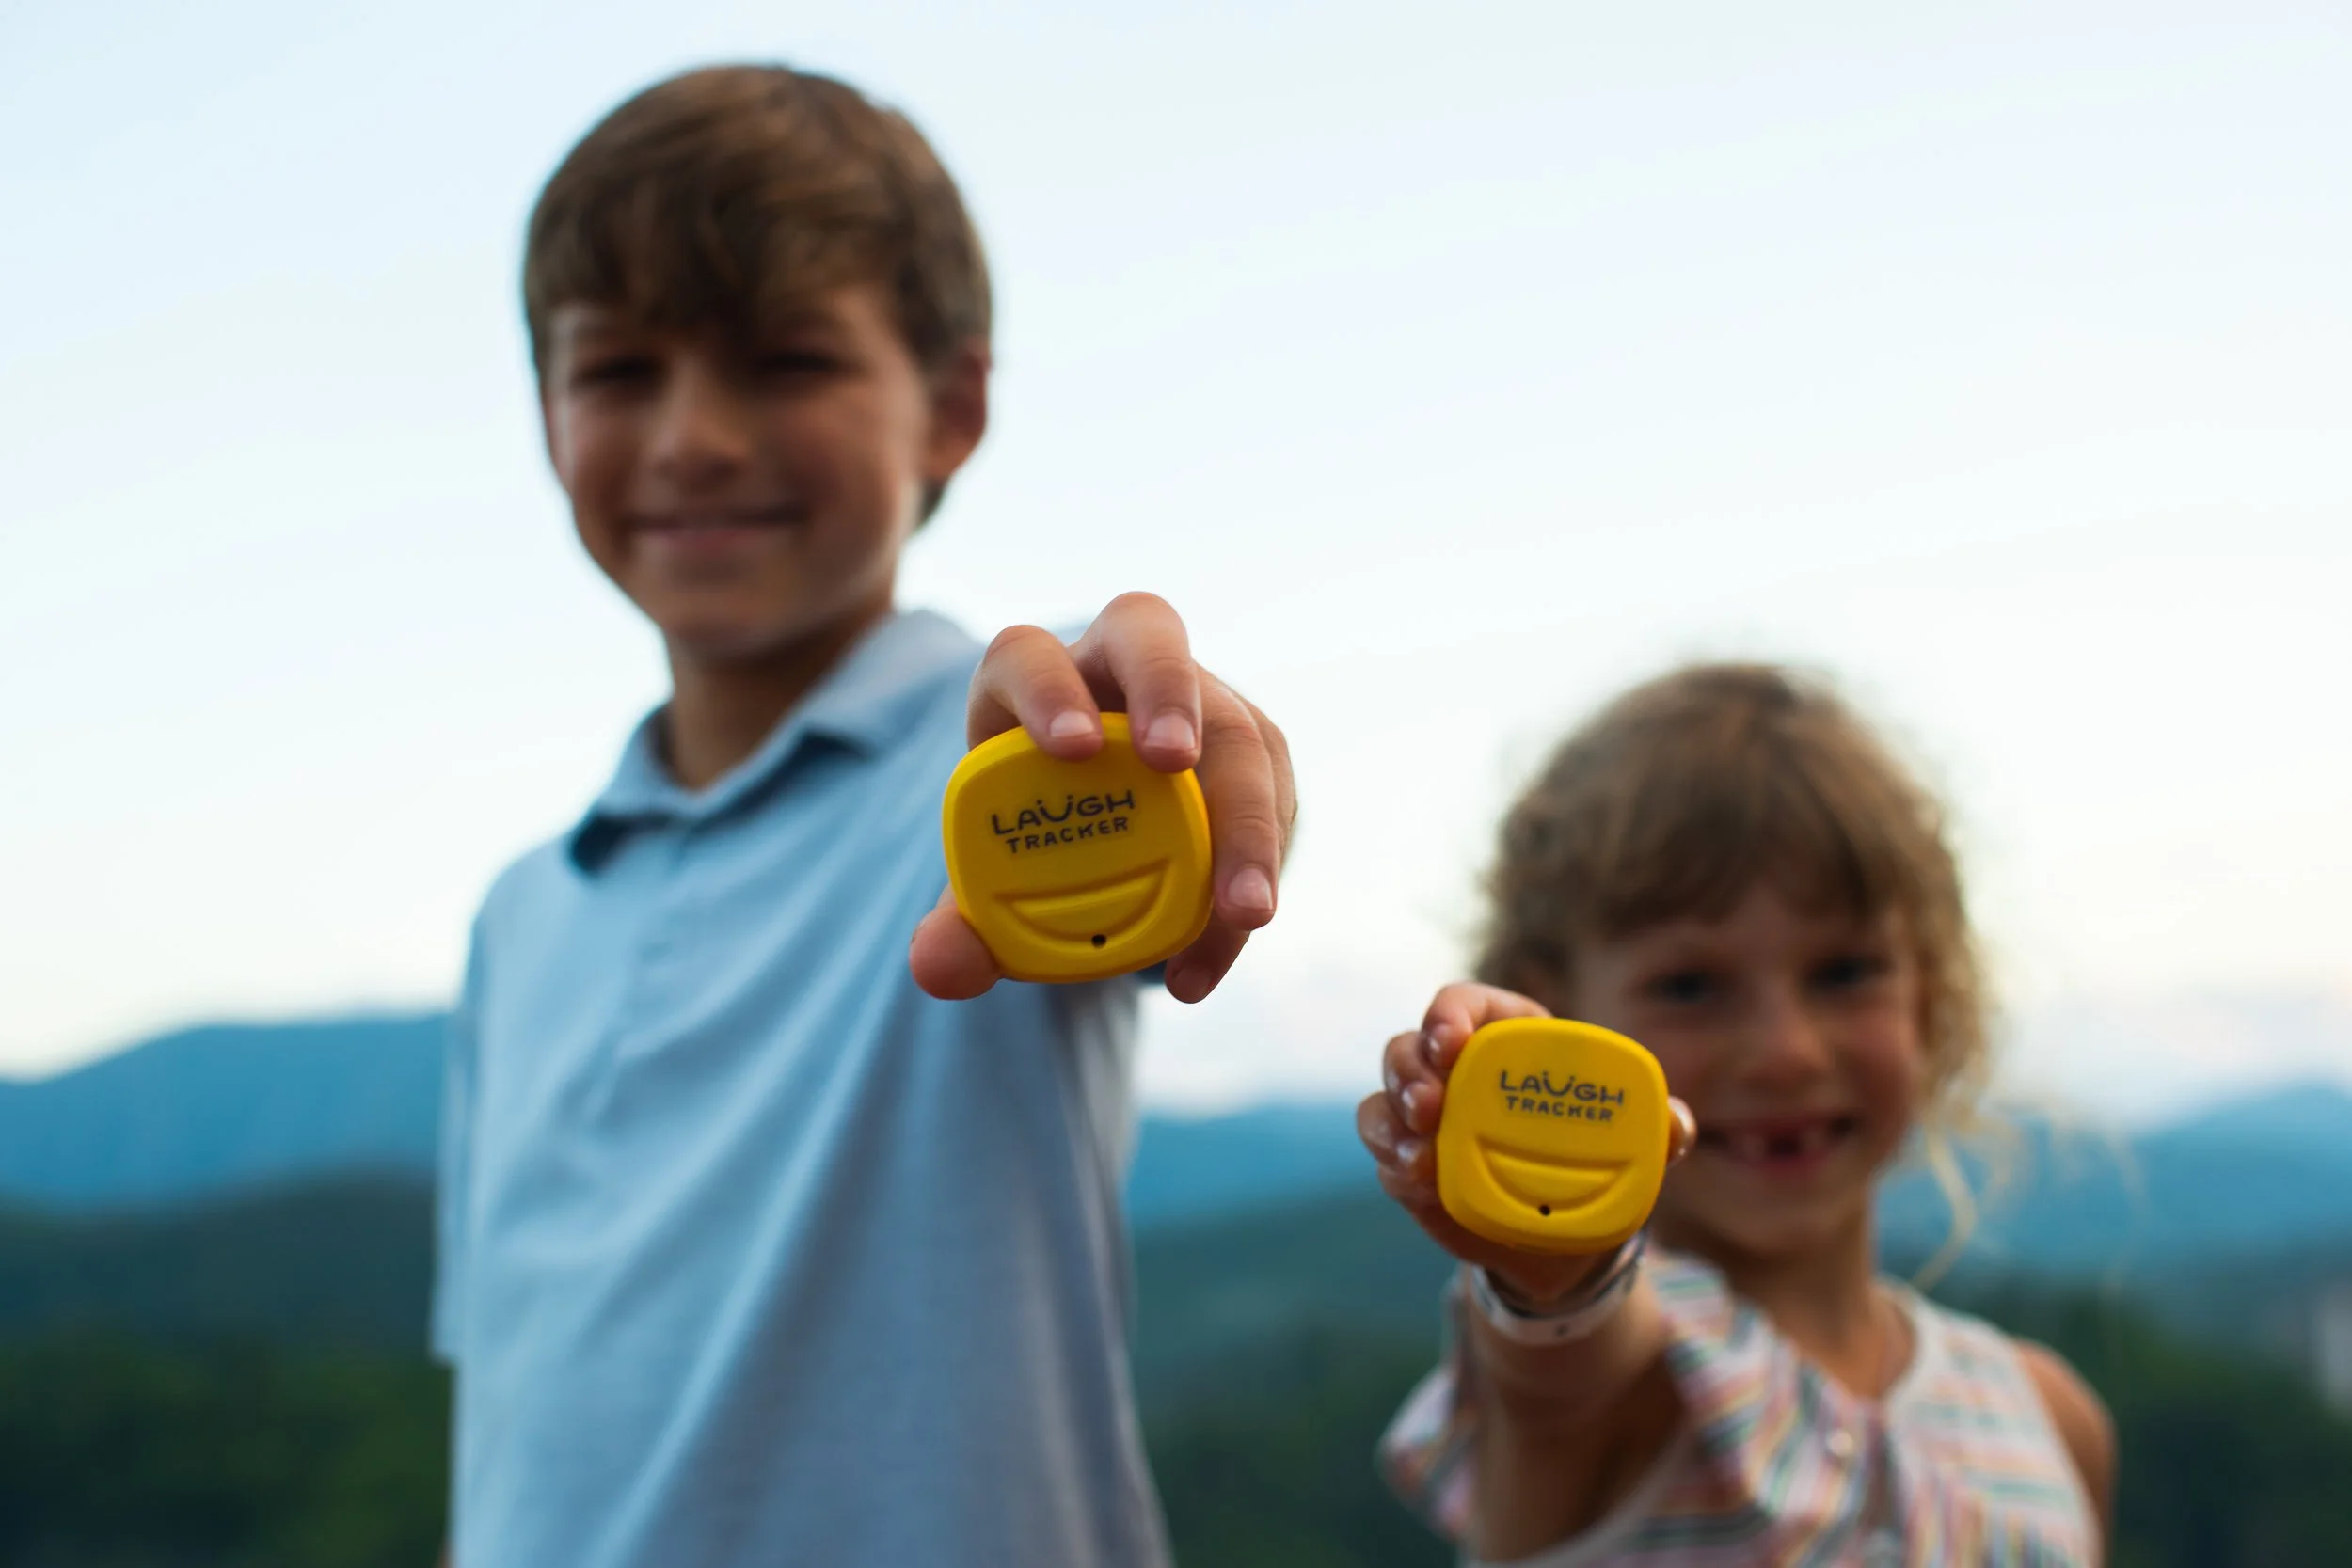
FUN METERS
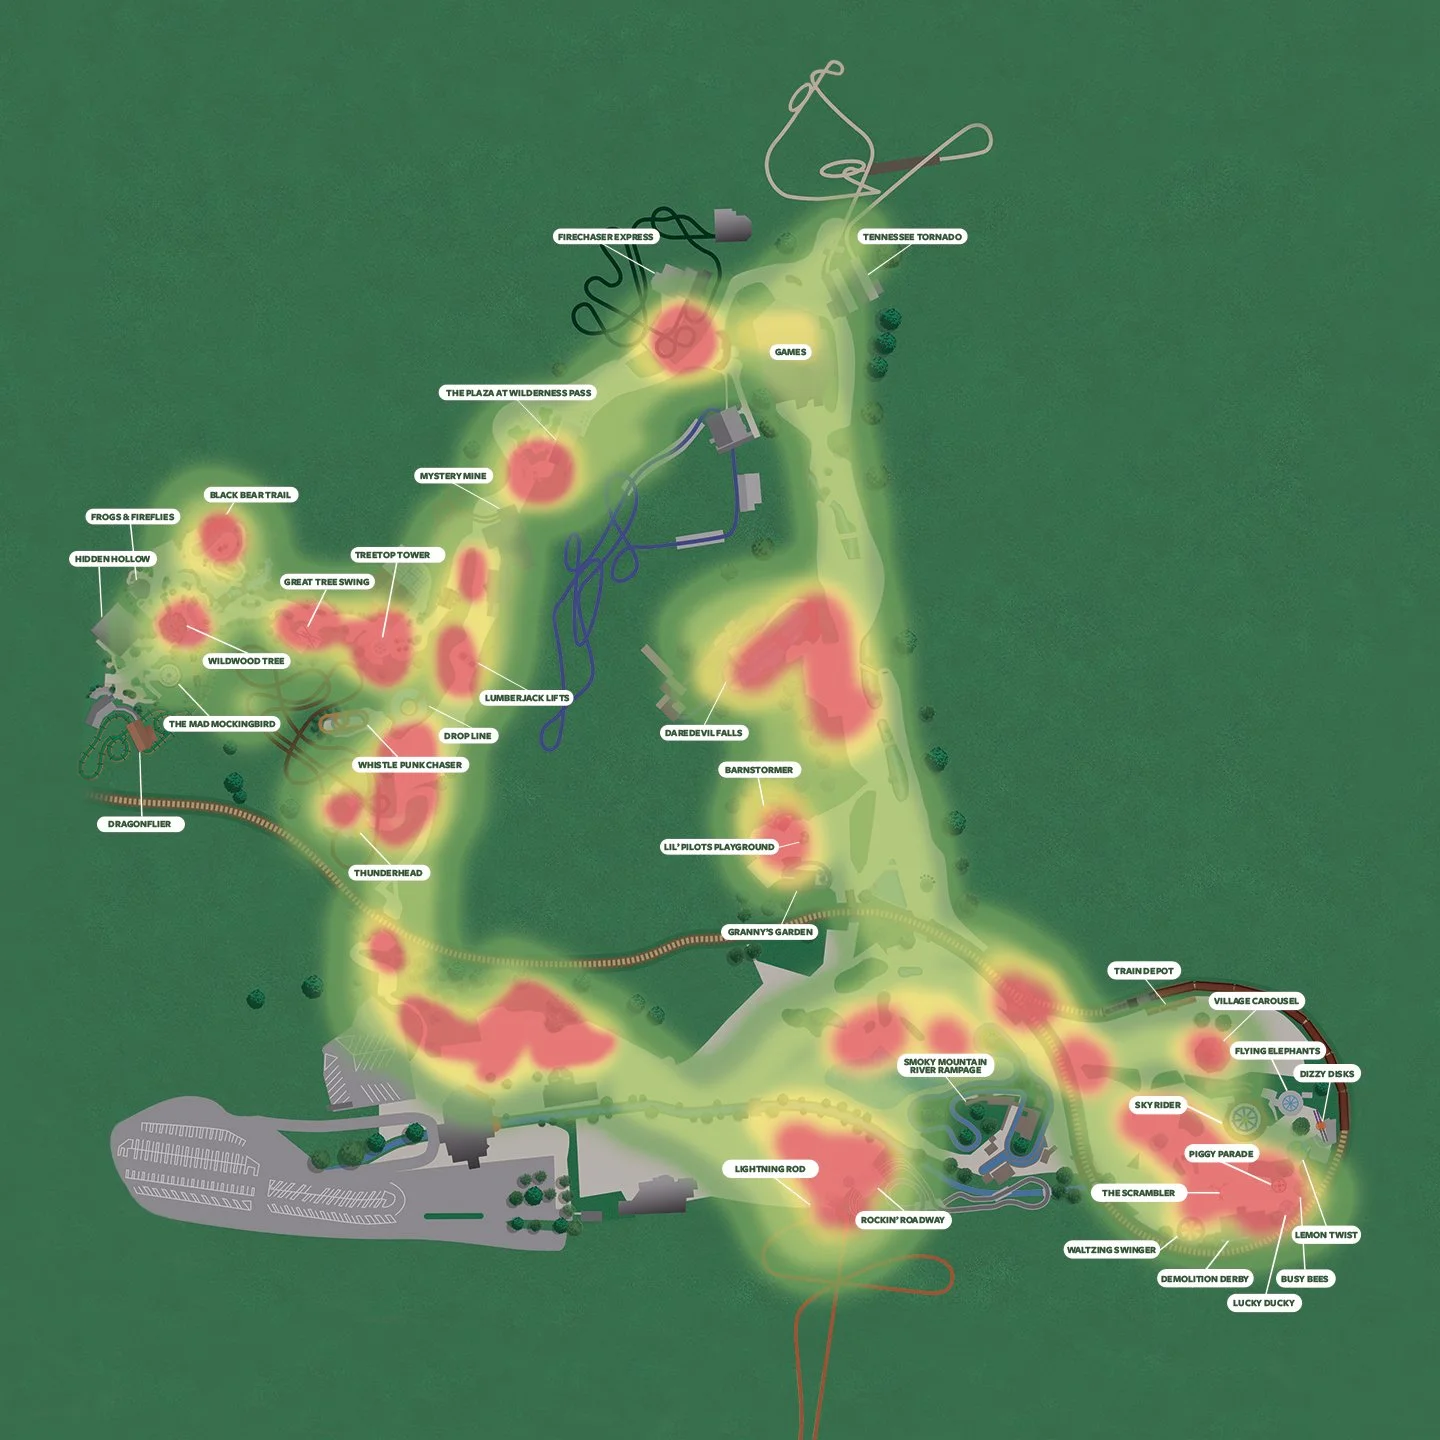
Collected data was fed into Fun Meters that provide a visual display of fun at a given location. We then created a heat map from the data to show parents where the most laughter occurs.

DOLLYWOOD LAUGH MAP
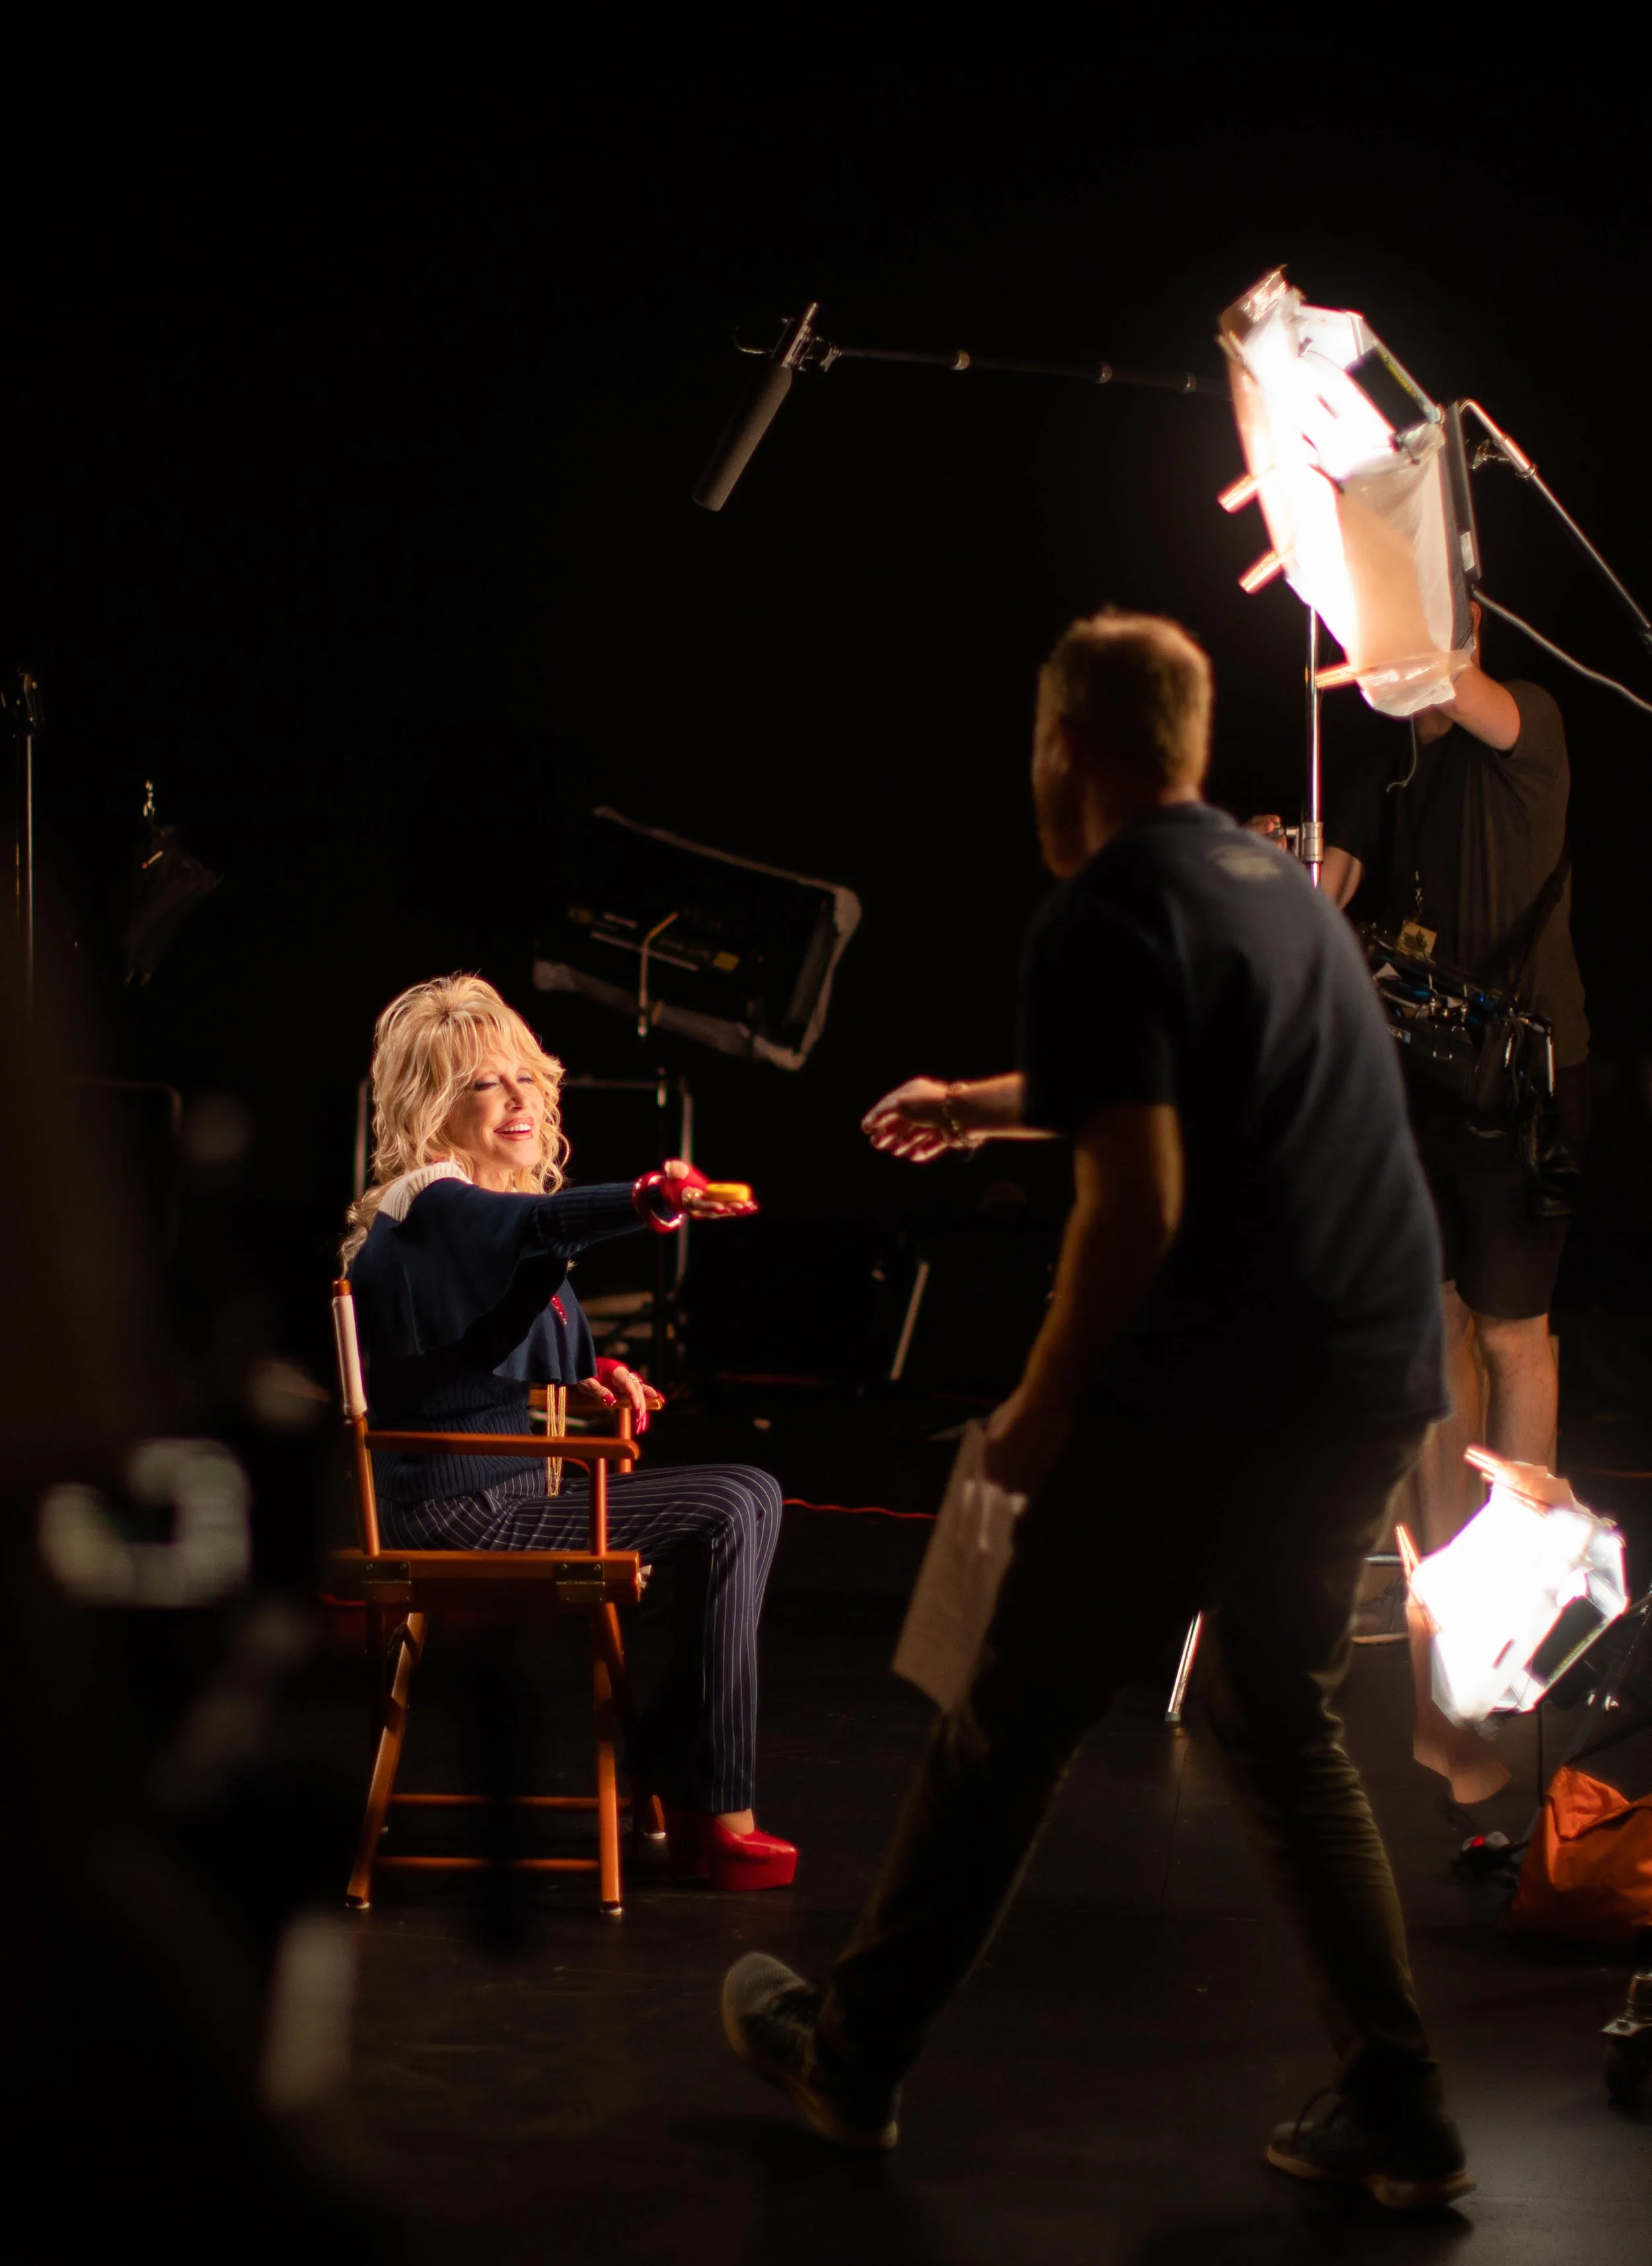
DOLLY!
I even got to meet the legend herself!


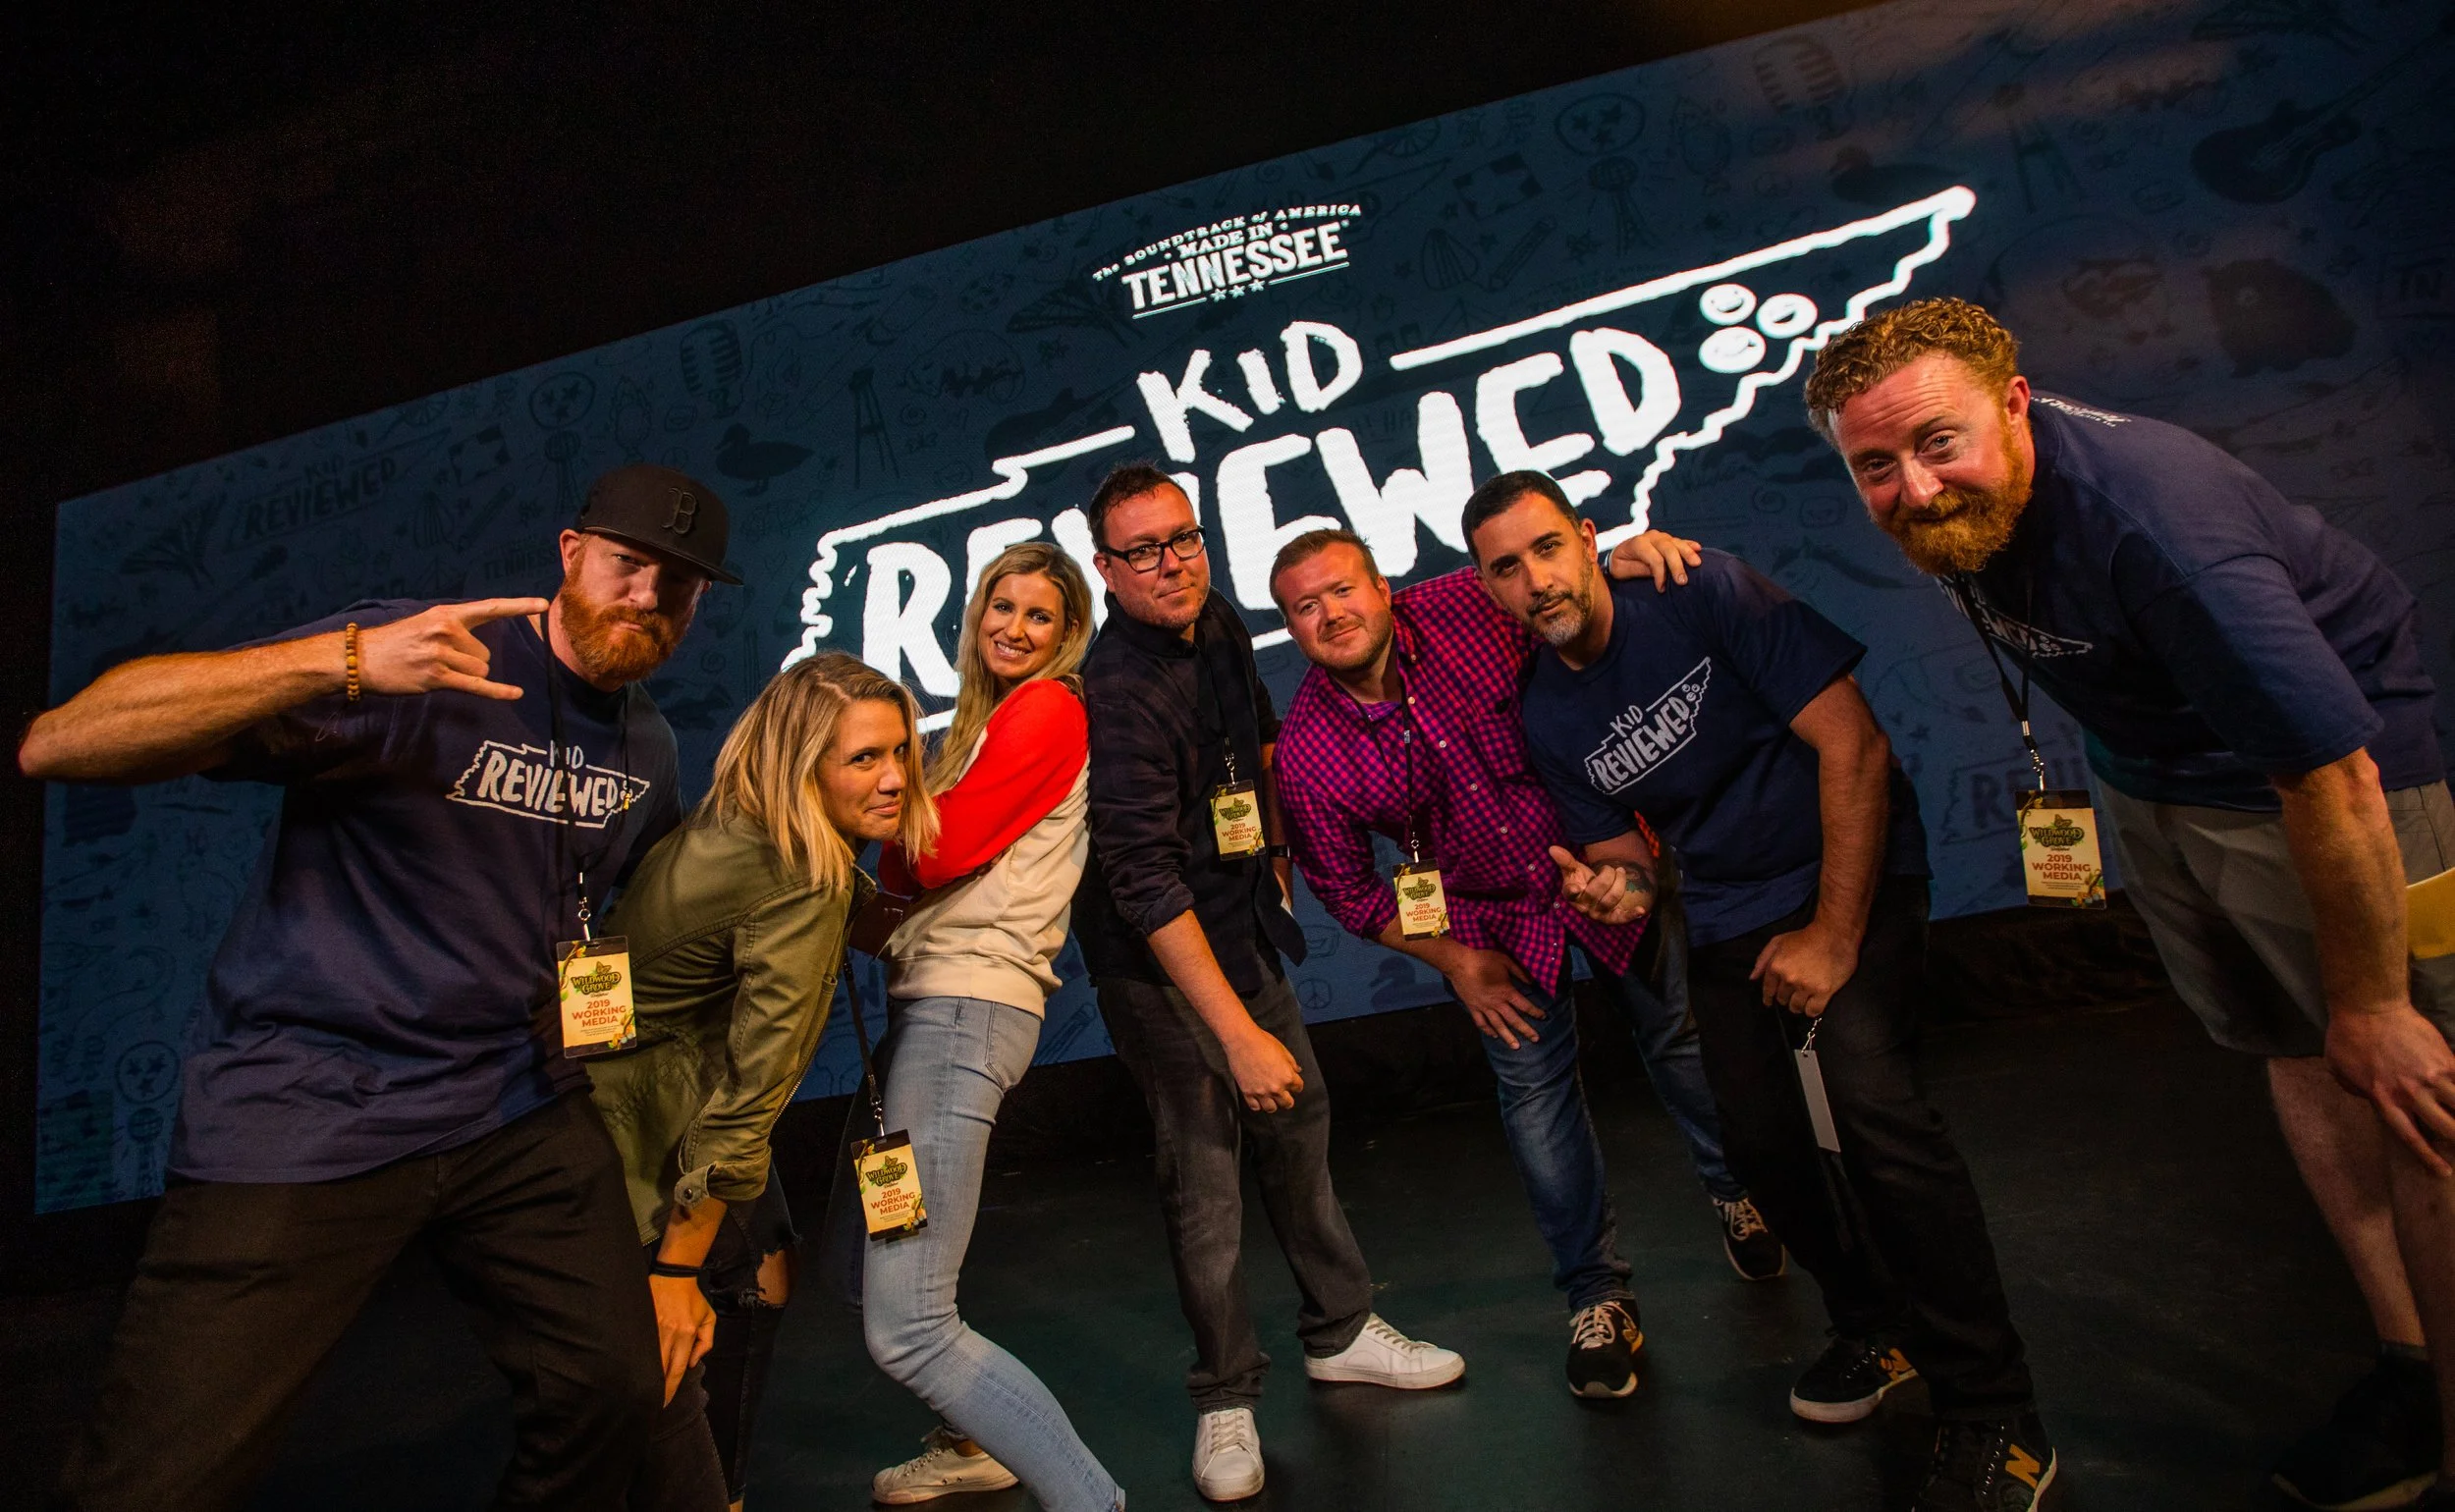
THE TEAM
You can also read the writeup here in AdAge